Report #: Q0284
One Dashboard
The One Dashboard is intended to give you visibility into the health and trajectory of your business and provide your team with the ability to plan and change. The One Dashboard provides accurate cash flow and cost forecasting to allow your business to be more proactive in your planning rather than relying upon historical data.
The One Dashboard does not require any ‘extra’ work in order to function – it simply pulls together your ‘regular’ planning into one condensed forecasting tool.
Break Even Forecast
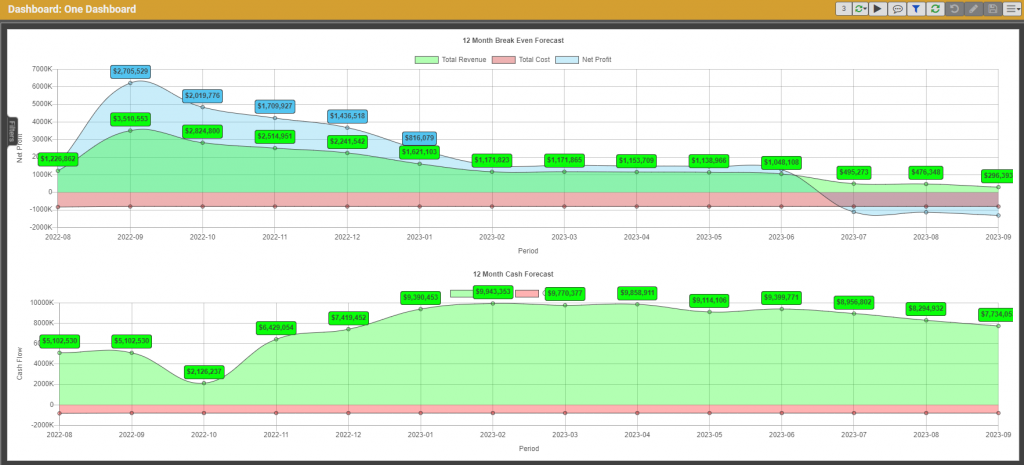
The top graph of the One Dashboard, labeled “Break Even Forecast” (Q0280), represents profitability – what the income statement should look like, both for the previous periods (up to 6 months) and forecasted into the future (up to 24 months). The dashboard displays Total Revenue, Total Costs, and Net Profit. Each data point can be expanded to see the underlying data. Cost and Revenue components are defined and calculated using the logic found here: One Dashboard Revenue and Cost Calculations
Revenue Sources:
- Projects
- Recurring
- Transactional
Expense:
- Recurring (fixed)
- Variable (project material costs, transactional costs, etc)
Revenue – Expense = Net Profit
Cash Forecast
The bottom graph of the One Dashboard, labeled “Cash Forecast” (Q0231), represents liquidity, and provides visibility into the current and forecasted future cash position of your company by leveraging the information within Q360 as it pertains to bank account balances and expected receivables and payables over a given period. Further detail on the information behind the Cash Forecast and the more detailed Cash Flow Forecast report can be found here: Cash Flow Forecasting
For information on other key reports, check out the webinar here.