Overview
The Call Profit report in Q360 offers a comprehensive overview of the financial performance of Service Calls. This report merges data from the Call Header and Profit tabs, presenting a detailed snapshot of key financial metrics associated with each Service Call. It helps organizations monitor profitability, manage costs, and identify areas for improvement in Service operations.
Report Filters
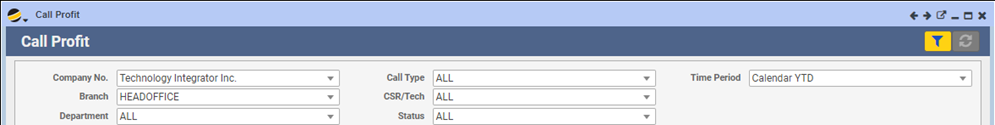
The Call Profit report includes several filters at the top to help refine the displayed data. Understanding how to use these filters will allow you to focus on specific areas of interest:
- Company No: The specific Company or Division for which you want to view Call profit data
- Branch: Branch locations
- Department: Departments
- Call Type: Type of Call, such as “Service,” “Maintenance,” or “Inspection”
- CSR / Tech: Customer Service Representative (CSR) or Technician assigned to the Call
- Status: Status of the Call, such as “Open,” “Closed,” “Dispatched,” etc.
- Time Period: Defines the date range for the Calls you wish to analyze. Options include specific dates, months, or fiscal periods
Report Layout
The report is structured into various columns, each providing essential information about the Service Call:
- Call #: The unique identifier for each Service Call
- Date: The date the Call was logged
- Company: The Company or client associated with the Service Call
- CSR: The Customer Service Representative who handled the Call
- Problem Code: A brief description of the issue or Service performed
- Call Type: The Type of Service Call, such as “Service” or “Maintenance”
- Branch: The Branch office where the call was initiated
- Department: The department responsible for the Service Call
- Status: Current status of the Call, e.g. Open, Closed
- Model: Model number of the equipment serviced
- Type: The category of Product or Service provided
- Invoice: The total invoiced amount for the Service Call
- Material Cost: The cost of Materials used during the Service Call
- Labor Cost: The cost of Labor associated with the Service Call
- Vouchered: Indicates whether the costs have been vouchered
- Total Cost: The combined total of Material and Labor costs
- Profit: The profit earned from the Service Call
- Margin: The profit margin percentage
Using the Report
- Filtering the Data: Begin by selecting the appropriate filters at the top of the report. For example, to view all Service Calls handled by the “Head Office” branch in the “Engineering” department, adjust the filters accordingly
- Analyzing Profitability: The report provides detailed profitability metrics for each call, allowing you to identify which services are generating the most revenue and which may be incurring losses
- Reviewing Costs: The report breaks down costs into Material and Labor categories, helping you understand the cost drivers for each Service Call
- Margin Analysis: The profit margin column is particularly useful for quickly assessing the financial health of each Service Call. A negative margin indicates a loss, which may require further investigation, unless this is typical for your organization, as when revenue is added to the Service Contract via periodic billing
Best Practices
- Regular Monitoring: Regularly review the Call Profit report to identify trends, such as recurring issues with profitability or high Material costs
- Drill Down: Use the report in conjunction with other financial reports such as the Service Contract Profitability Report for a more detailed analysis of specific Calls or Departments
- Adjust Filters: Experiment with different filter combinations to get a clearer picture of specific areas, such as a particular CSR’s performance or Calls within a particular timeframe
Conclusion
The Call Profit report is an invaluable tool for monitoring the financial performance of Service operations. By regularly reviewing this report, you can ensure that your Service Calls remain profitable and align with your organization’s financial goals.