Path: Dashboards > Sales > Sales Opportunities
Purpose:
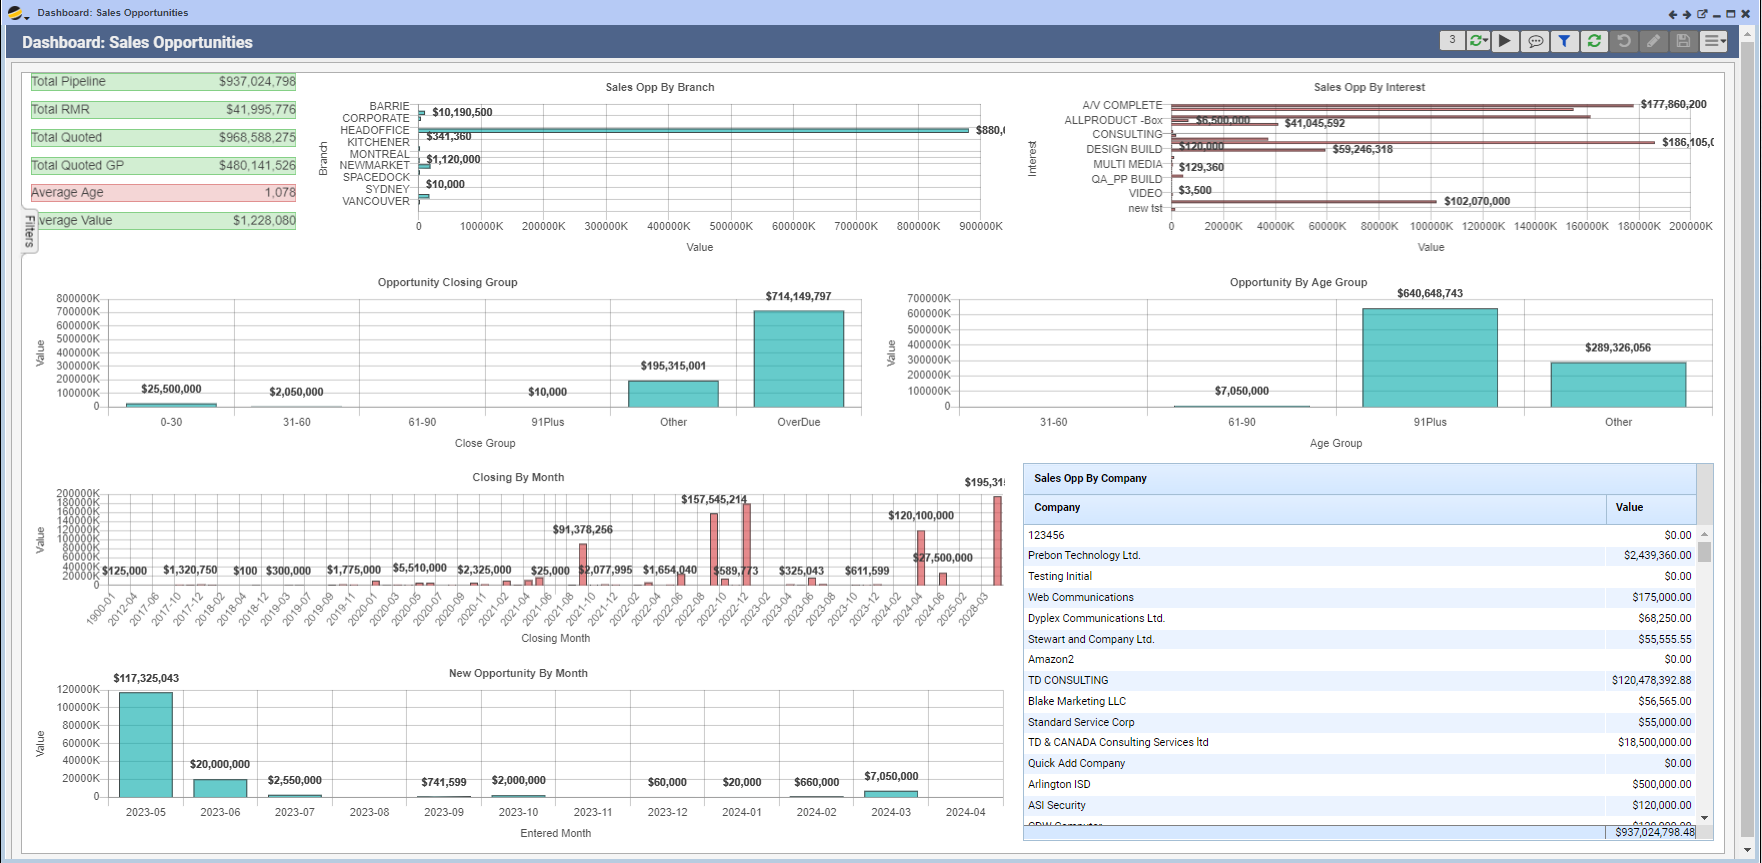
The Sales Opportunities Dashboard displays active sales opportunities and their values. Management may use this dashboard as a high level overview of their team’s opportunities.
Key Benefits:
- Sales reps / managers may view sales opportunities by Branch, Interest, and Company
- Sales reps / managers may view new sales opportunities broken out by month, or by closing date for forecasting purposes
- This dashboard allows the user to compare total opportunities in the pipeline to quoted opportunities and view quoted gross profit
- This dashboard calculates the average age and average value of opportunities
- Clicking on any individual bar in any bar graph will automatically filter the Opportunities Grid (bottom right) to only the opportunities included in that value
Sections:
- Summary (Color coded red / green):
- Total Pipeline
- Total RMR
- Total Quoted
- Total Quoted GP
- Average Age
- Average Value
- Sales Opp by Branch: displays value of sales opportunities by Branch
- Sales Opp by Interest: displays value of sales opportunities by Interest i.e. Design Build, Consulting, Multi Media
- Opportunity Closing Group: displays value of opportunities by Close Group i.e. 0 – 30 days, 31 – 60 days, Overdue
- Opportunity by Age Group: displays value of opportunities by Age Group i. e. 31 – 60 days, 61- 90 days, 91+ days
- Closing by Month: displays value of opportunities by month (based on Close Date)
- New Opportunity by Month: displays new opportunities by month (based on Entered Date). May be displayed as either a bar chart OR a grid – toggle between the two by clicking the graph or grid icon above this section
- Opportunity Grid: displays all active opportunities by Company OR active opportunities included in clicked value on any bar chart (see benefit above). May be displayed as a bar chart or grid – toggle between the two by clicking the graph or grid icon above this section
Filters Tab:
- Company No.
- Branch
- Department
- Sales Group
- Sales Rep
- Interest
Display Options:
- Live Data: Graph Sales Opportunity – click the pop-out icon above any section. A new window will open where you may further refine your data search and run a live data report
- View section independently – click the single window icon above any section. The selected section will display alone in a large window. Note: Closing this window will close the dashboard. To return to the previous view (all sections), click the filter icon
Best Practices:
- Sales Manager should review this dashboard daily
- View the Sales Opportunity graph and drill into individual opportunities as needed
- This dashboard is only as accurate as the data that feeds it. Individual Opportunities should be filled out as completely as possible and updated regularly
Note: Data labels on the bar charts may be displayed or hidden by clicking the ellipsis (…) icon
Note: Graph Sales Opportunity Live Data Report (see display option above) > Filters tab includes options to limit dates in the Live Data Report. When using the Date Range drop down options OR selecting your own Start Date and End Date, you MUST select “ALL” from the Active / Closed drop down menu. Selecting the “Active” option in this instance will negate the date selections above this field