Report#: Q0298
Project Bookings / Revenue / Backlog is used to provide a view of New Bookings, Previous Backlog, Total Backlog, Earned Revenue and Gross Profit Backlog by period.
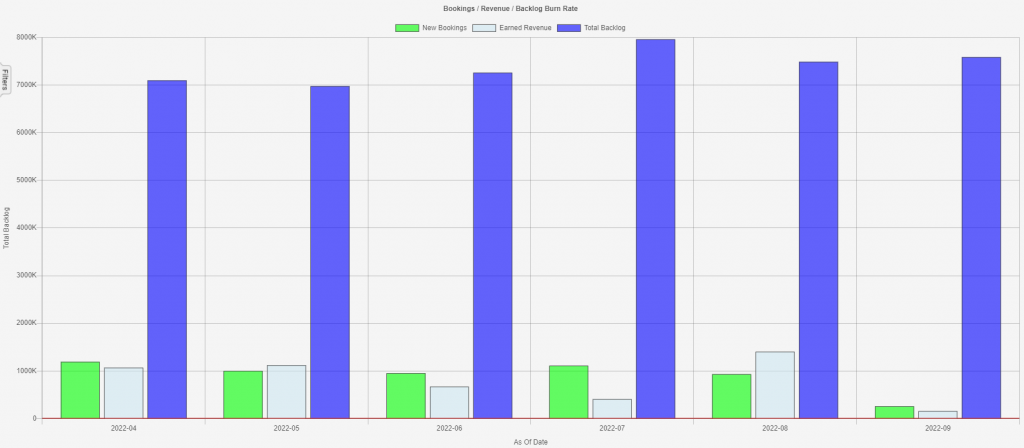
This report is best viewed initially as a graph (right click on the grid and select “Graph Grid”). This view shows New Bookings, Earned Revenue, and Total Backlog for a specific period.
This report is useful for visualizing trends in a company’s business performance and understanding the relationship between Bookings, Revenue and Backlog. It follows the math that Ending Backlog of the Previous period, plus New Bookings, minus Earned Revenue, equals Total Backlog (ending backlog for that period).
Please keep in mind that New Bookings may vary significantly from the total of all closed new bookings, as it includes the balance of new contracts, cancelled contracts and/or adjusted contract value through change orders.
If Earned Revenue exceeds New Bookings (again, this is net), then the Ending Backlog will be less than the Ending Backlog of the prior period. And vice versa.
At a glance, a company can see its seasonality in New Bookings (if any), as well as its seasonality in Earned Revenue (if any), and provides an easy year over year or period to period comparison.
Grid View
When the grid view is selected, the report shows the line item details by Branch and Department. Filter Exclude (right click on the grid and select “Filter Exclude”) can be used to exclude particular branches or departments and display only those desired.
Run report
On the filter tab, Select the As Of Date which defines the Start Date and End Date; Entity; and Branch. If the Project Bookings / Revenue / Backlog is desired by Branch, simply select the appropriate Branch on the filter tab.
For information on other key reports, check out the webinar here.